Matplotlib graphics for the metropolis beamer theme
Beamer is a great tool to make presentations with, and is indispensable to those who need to typeset mathematics within their slides. Beamer is actually just a LaTeX document class, so its syntax and setup is familiar to those who have experience working with TeX and friends.
Despite Beamer’s popularity in industry and academia, the default theme options are, to put it politely, lacking. The default themes look cluttered, clunky and out of date. Enter here: Metropolis. Metropolis is a modern Beamer theme which looks minimal, stylish and professional, and has become my go-to beamer theme.
Integration with matplotlib
Recently, I was busy creating a presentation with beamer and the metropolis theme. The presentation was coming along well, and in my own biased opinion I thought the presentation had a certain aesthetic charm.
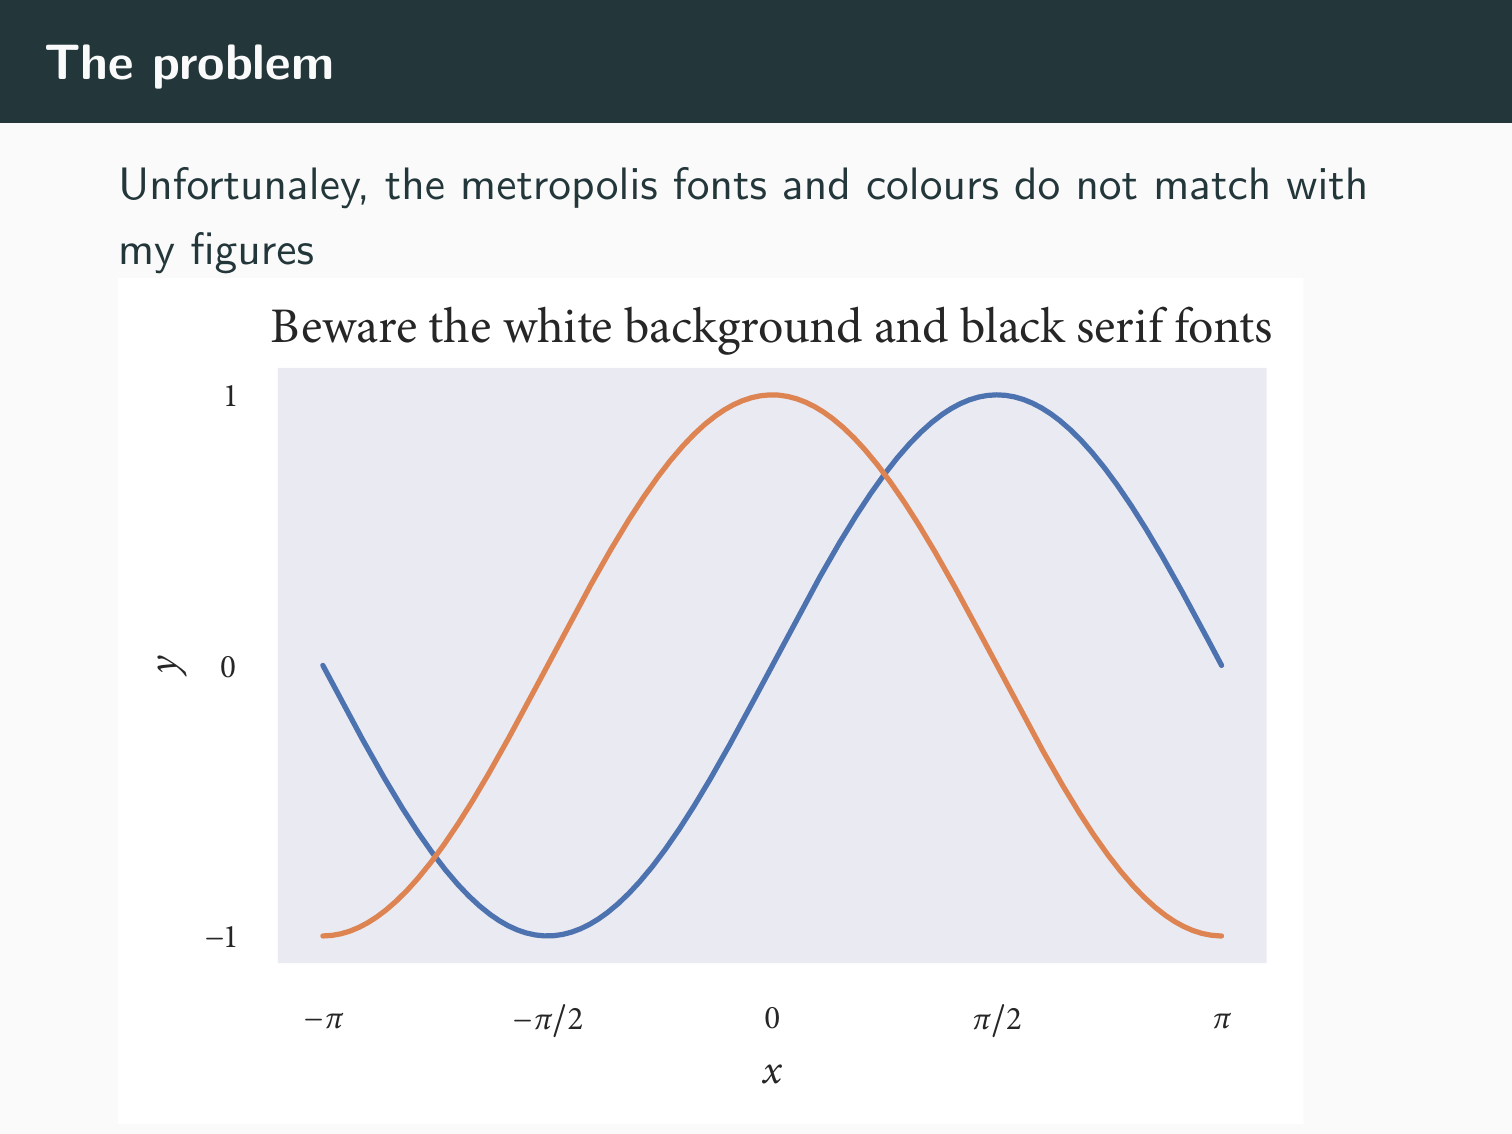
This was until I paid more attention to the figures I’d included. By themselves the figures looked good, but once inserted into the presentation they clashed with the metropolis theme. The fonts in my plots were serif, yet metropolis was using a sans-serif font. I’d set my axis labels, titles etc. in a black font. Yet, metropolis sets text in a colour it calls mDarkTeal. I was also distressed by the off-white background of the metropolis slides. My figures had a white facecolor, which meant all the plots I’d included had a white box around them.
There are many things I can live with, but poorly integrated graphics in a research presentation isn’t one of them.
An obvious solution
Matplotlib provides a pgf backend, which allows plots to be exported as pgf drawing commands (if you’re brave enough and want to learn more about pgf, you can check out the pgf/TikZ manual which sits at a pretty 1247 pages). Using this backend, the drawing commands of the plots can be inserted directly into the presentation. The upshot? All the fonts will be set as in the metropolis theme: in an mDarkTeal FiraSans font.
Easy right? Well, almost. I think the pgf backend of matplotlib is great, but rendering plots this way does have its drawbacks. A particular problem is the amount of memory plots rendered this way consume, this becomes more acute once a reasonable number of elements are included in the plot.
This memory issue isn’t a huge problem, and there are ways around it. If you’re compiling with pdfLaTeX one solution is to increase the main memory limit. Another solution would be to compile with luaLaTeX, which can dynamically alter its memory limit as needed.
Still, though, my work machine doesn’t have a luaLaTeX build, and I didn’t want to start messing around with pdfLaTeX’s memory limit. I was hoping for a pure matplotlib solution. And so the search continued
Attempt #2
I’d heard whisperings about the matplotlib2tikz package on my jaunts over at Stack Overflow, but I’d never had reason to use it (shameless SO plug). I figured this would be a good time to give it a look in. The idea behind matplotlib2tikz is similar to that of the pgf backend. Here though, the plots are saved as TikZ commands, which is a higher level language than pgf. With this, I’d hoped that the memory consumption of the resulting plots would be more reasonable than those rendered with the pgf backend. As it happens my naivety had misled me, and I quickly ran into memory problems with matplotlib2tikz. Oh well…
An actual solution
Aha, and here our rollercoaster ride rolls into a satisfying matplotlib-based ending. I’d become aware of the LaTeX package FiraSans, and figured I could add this into the rcParam text.latex.preamble to match my fonts between metropolis and matplotlib. I could also alter the rcParams such that all text was set in the mDarkTeal colour. The finishing touch was to set the savefig.facecolor to the off white background of the metropolis theme.
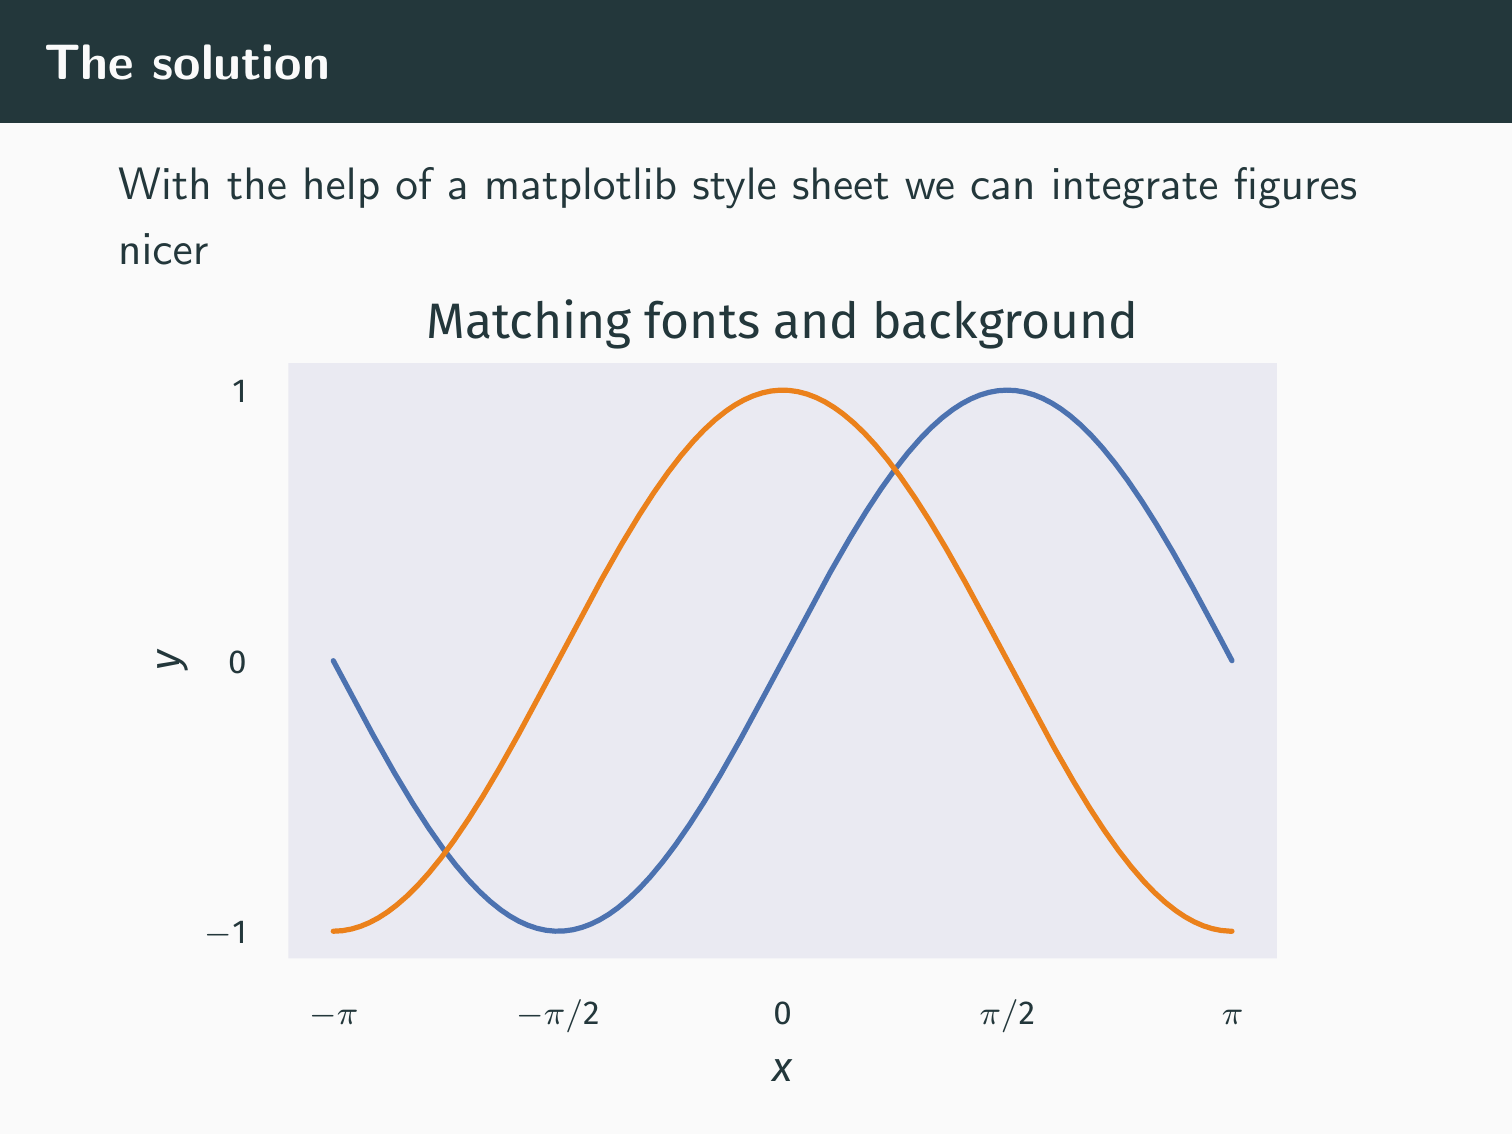
Rather than altering these rcParams in every one of my plotting routines, the proper solution here was to create a matplotlib style sheet. These allow a user to very quickly change a number of styling aspects of their plot. The style sheets are burrowed away in a warren of directories and subdirectories. To find yours you’ll need to find the path to your python distribution, and from there work your way down to lib/python3.6/site-packages/matplotlib/mpl-data/stylelib. Here I created the file metropolis.mplstyle with the contents:
# Matplotlib style file to create plots that integrate nicely
# with the metropolis beamer template

# Colours pulled from beamermetropolis.sty
# Background colour in beamermetropolis.sty is as black!2
# not very useful for matplotlib. Approximate as FAFAFA

axes.axisbelow: True
axes.edgecolor: White
axes.facecolor: EAEAF2
axes.grid: False
axes.labelcolor: 23373b
axes.labelsize: 10
axes.linewidth: 0

# Set up colour cycle from metropolis
axes.prop_cycle: cycler('color', ['4C72B0', 'EB811B', '14B03D', '604c38'])

# Default size of single figure spanning textwidth of thesis
figure.figsize: 4.2519699737097, 2.627861962896592
figure.titlesize: 10
figure.facecolor: FAFAFA

font.family: sans-serif
font.size: 10

grid.color: white
grid.linestyle: -
grid.linewidth: 1

image.cmap: Greys

legend.fontsize: 10
legend.frameon: False
legend.numpoints: 1
legend.scatterpoints: 1

lines.antialiased: True
lines.linewidth: 1.25
lines.markeredgewidth: 0
lines.markersize: 7
lines.solid_capstyle: round

patch.facecolor: 4C72B0
patch.linewidth: .3

savefig.facecolor: FAFAFA
savefig.format: pdf

text.usetex: True
text.latex.preamble: \usepackage[T1]{fontenc}, \usepackage[lf]{FiraSans}, \usepackage{sfmath}
text.color: 23373b

xtick.color: 23373b
xtick.labelsize: 8
xtick.direction: out
xtick.major.pad: 10
xtick.major.size: 0
xtick.major.width: 1
xtick.minor.size: 0
xtick.minor.width: .5

ytick.color: 23373b
ytick.labelsize: 8
ytick.direction: out
ytick.major.pad: 10
ytick.major.size: 0
ytick.major.width: 1
ytick.minor.size: 0
ytick.minor.width: .5
Now, to make figures which integrate seemlessly with the metropolis theme, it’s simply enough to include the line plt.style.use('metropolis') at the top of any plotting scripts. I like this solution as it’s super simple to use, re-use and the results look great.